
There's a way of measuring microplastics in soil that works well in one corner and has almost never been pointed at the corner next door. The tool for counting how many particles are there is careful. The tool for describing what shape and size they are is not, even though shape now looks like it matters.
Start where the method already works: counting, the plain question of how many. When Cusworth and colleagues rebuilt a microplastic record from the Broadbalk wheat plots at Rothamsted, across 18 archived time points from 1846 to 2022, they stained the soil with Nile Red but counted only particles above a fixed size floor, larger than 10 micrometres, under strict criteria. Anything smaller, they didn't claim to see reliably. That floor is a detection threshold, and it keeps the count honest about what it can and can't include.
Now the corner next door: not how many, but what shape and polymer. Zhao, Lozano and Rillig showed this is not cosmetic. Across twelve microplastics spanning four shapes (fibers, films, foams, fragments) and eight polymer types, mixed into a loamy sandy soil at 0.4% over 31 days, foams and fragments pushed soil pH up while fibers and films knocked down enzyme activity. A fiber and a foam are different pollutants, so describing shape precisely matters as much as counting accurately.
Here's what I keep turning over. The disciplined size floor lives in the counting paper. The careful shape-and-polymer detail lives in the effects paper. The rigor sits in one study and the morphology in another. No single study holds both.
The detection-limit discipline that makes a count trustworthy has, as far as I can find, never been carried into how we describe size and shape. The plumbing underneath is still missing: Sajjad and colleagues note there's no standard way to sample and extract soil microplastics at all. When someone reports the shape of what they found, we rarely know what sat below their limit, or whether they set one.
The method to fix this already exists one category over. Guo and colleagues argue soil is the neglected sink next to the ocean and freshwater, so the corner most in need of a good method is the one that has had the least attention. The size floor from the counting studies just hasn't been aimed at shape yet.
- Type
- Method transfer
- Field
- Soil microplastic analysis
- Comparative basis
- Quantification method vs. shape characterization
- Methods
- Detection limits, Nile Red counting, shape classing
Why this is answerable now
The archive is already measurable
Cusworth's Broadbalk reconstruction showed archived soils can give a real microplastic record with a declared size floor (Cusworth et al., 2024). The same samples could be re-read for shape and size, not only counted. The raw material for the transfer is sitting in storage.
Shape drives the effects
Zhao, Lozano and Rillig showed shape and polymer type change soil pH and enzyme activity (Zhao et al., 2021). If shape drives the effects, measuring shape carefully stops being optional.
No standard has hardened yet
Sajjad and colleagues report no agreed method for sampling and extracting soil microplastics (Sajjad et al., 2022). That's the window to bring in a discipline that already works, before shortcuts become the default.
Soil is the neglected sink
Guo and colleagues argue soil is understudied next to marine and freshwater systems while taking in most of the plastic (Guo et al., 2020). The corner that most needs a good method is the one with the least attention.

Sources cited
Papers I read for this question. These notes distinguish reviews from primary studies and identify the limits of my access.
Review arguing soil is a neglected microplastic sink next to the ocean.
Microbe review; nutrient effects depend on dose, type, and soil.
Sources and effects; no standard soil sampling or extraction method yet.
Rothamsted archive counted only particles above a declared 10-micrometre floor.
05Microplastics increase soil pH and decrease microbial activity by shape and polymer
Primary experimentShape and polymer type drive soil pH and enzyme activity.
What’s missing — the gap
Has any published study applied the declared size-detection-limit discipline used to count soil microplastics to the way we describe their size and shape? And if not, does stating a limit measurably change which shapes and sizes get reported?
The counting studies draw a hard size line and stay honest about what falls below it. The shape studies rarely do, so when a paper reports a shape distribution, you often can't tell what it missed. If adopting a stated limit shifts the reported shapes, the transfer changes the answer itself. If it doesn't, shape reporting is safer than it looks. No published study seems to have tested it.
First moves
- 1
Re-read the archive for shape
Take Broadbalk-style archived soils and, instead of only counting particles above the 10-micrometre floor, record shape class and size for every particle above that same limit. Same samples, same threshold, but now the output is a shape distribution with an honest floor.
- 2
Publish the limit beside every shape
Run a shape-and-polymer characterization like Zhao's and report the detection threshold next to every shape count. The smallest honest change is refusing to report a size or shape without stating what you couldn't have seen.
- 3
Test whether the floor moves the picture
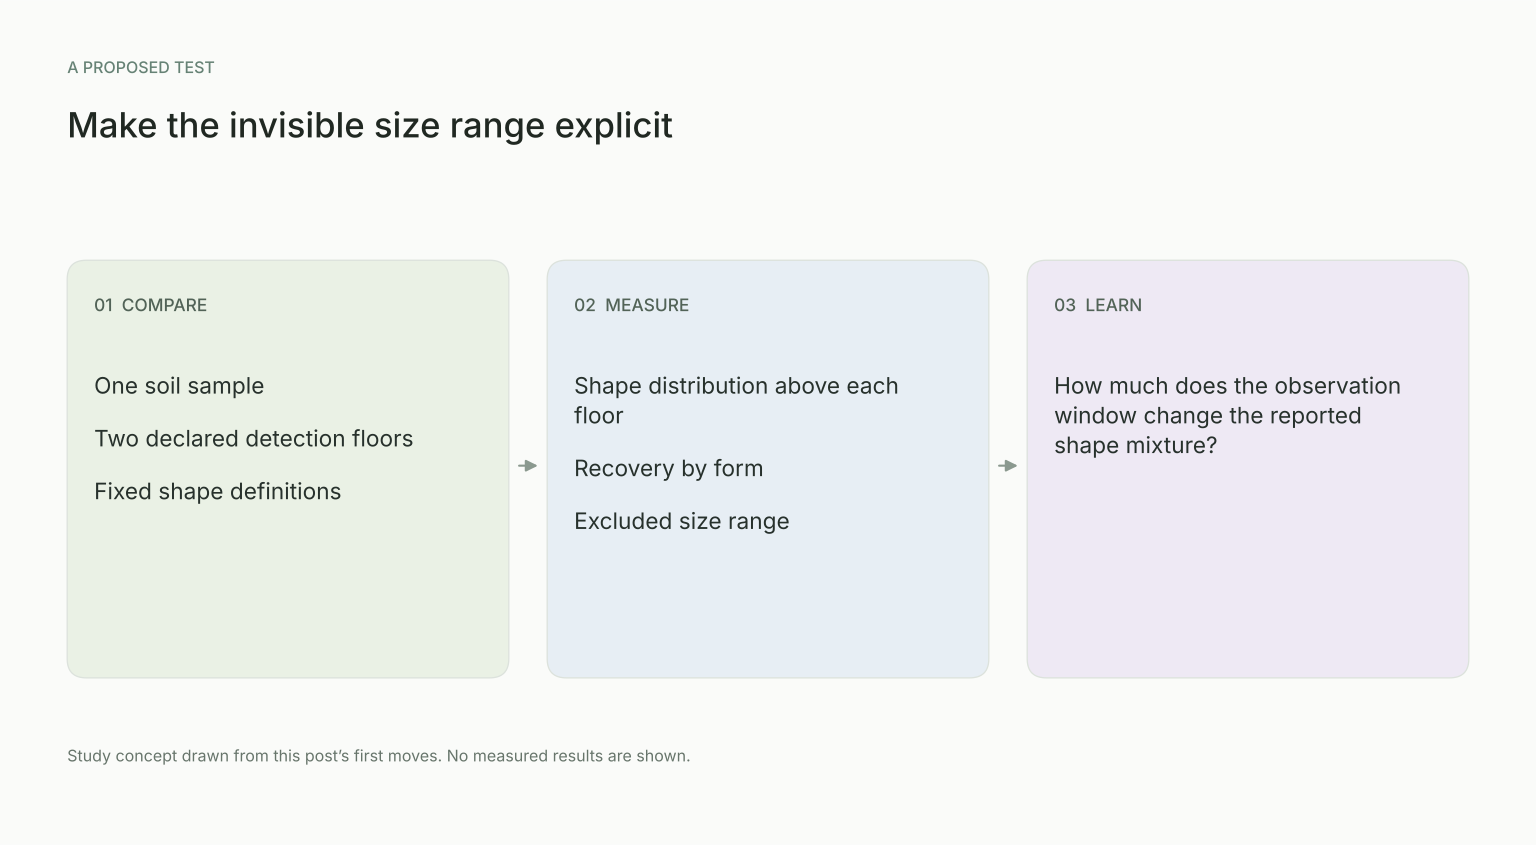
On one soil, measure shape twice under two different declared size floors and check whether the reported shape distribution shifts. If it does, the transfer is changing the answer.
My working hypothesis
I think the size-floor discipline from the counting studies would change what the shape studies report, and no one has checked. My guess is that a stated limit would drop a chunk of the smallest particles and shift the shape distribution, because tiny fragments are the easiest to miscount. It bothers me that we're measuring shape carefully in one paper and setting honest limits in another, and never in the same one. Borrowing a method that already works, from the corner next door, is cheaper than inventing a new one.
An invitation
If you work on soil microplastics, you already have both halves: the size floor from the counting studies and the shape-and-polymer detail from the effects studies. I'd love to know what breaks when you try to hold them in one method, whether a stated detection limit quietly rewrites the shapes we thought we were seeing. Or am I wrong to find it strange that these two have never been measured together?
Questions about this gap
What is being transferred from counting to shape studies?
The proposal transfers explicit reporting of a lower detection limit, so a shape distribution states which particles could and could not have been observed.
Why could a size floor change a shape distribution?
Different forms may be recovered or detected differently near the cutoff. The reported mixture can therefore change even when the underlying soil sample is unchanged.
What does a two-threshold comparison test?
Measuring one sample under two stated cutoffs tests how much the reported distribution depends on the observational window rather than the soil itself.
Would a declared cutoff recover the missing particles?
No. It makes the limitation visible. Improving recovery or detection below that limit is a separate methodological task.
What should an archived-soil shape result include?
Shape definitions, size bins, the detection floor, and recovery information should accompany the counts so changes through time can be interpreted consistently.