There is a toolkit that counts plastic in soil, and it works well. It gets pointed at one size of particle and has never been aimed at the size below it.
Look at how the counting is done and the boundary jumps out. In the Broadbalk wheat archive at Rothamsted, Cusworth and colleagues digested soil with hydrogen peroxide, flocculated it with iron sulfate, separated particles by density in salt water, stained them with Nile Red, and counted them under a fluorescence microscope, keeping only particles larger than about 10 micrometres. That pipeline read a soil's whole plastic history: none before 1914, a clear rise from 1966 on. Everything smaller than roughly 10 micrometres, about a tenth the width of a hair, is invisible to the method by design.
The same floor shows up wherever the methods are strongest. Van den Berg and colleagues pulled microplastics from sludge-amended fields in Spain by floatation and filtration, sorting them into light and heavy density fractions, and found each sludge application added about 280 light and 430 heavy particles per kilogram of soil. Li and colleagues used density separation to identify mulch-film plastic as polyethylene and showed it made up 33 to 56% of the microplastics through a one-metre profile, with topsoil holding around 8885 particles per kilogram.
Both studies show the toolkit can count particles and trace them to a source. They share one blind spot. Li's method targets fragments under 5 mm, Cusworth's stops near 10 micrometres, and the nanoscale falls through both.
Here is what makes the silence loud. The reviews describe soil plastic sinking and spreading through the profile, moving up food chains, and carrying other pollutants like phthalates, antibiotics, and PAHs. As a rule, the smaller a particle gets, the more it moves and the more easily living things take it up. So the fraction most likely to travel, be eaten, and carry other chemicals is the fraction the methods cannot see.
Sajjad and colleagues also note there is not even a standard sampling and extraction method at the microplastic scale yet. I keep turning this over: the pipeline that made microplastics countable in soil has, as far as I can find, never been pushed down to the nanoscale to see what is already there.
- Type
- Method transfer
- Field
- Soil analytical chemistry, nanoplastics
- Comparative basis
- Micro-scale detection vs. nanoscale
- Methods
- Density separation, Nile Red fluorescence
Why this is answerable now
The method exists next door
Density separation, flocculation, and Nile Red staining are mature for microplastics in soil. The hard engineering is done. What is missing is pushing the detection limit downward, not inventing a technique.
The legacy keeps growing
Rothamsted shows concentrations climbing since 1966, and mulch studies imply a plastic legacy lasting centuries as particles sink deep and resist removal. If micro fragments keep breaking down toward nano, the reservoir is growing while we do not measure it.
The entry points are mapped
Mulch film, sewage sludge, and fertiliser are documented, quantified sources of microplastics into farmland. The same well-characterised streams are the obvious first places to look for the nanoscale fraction.
No standard has locked in
Sajjad and colleagues note there is still no standard soil microplastic method. Setting nanoscale detection limits now, before habits harden, is a chance to avoid another patchwork of numbers no one can compare.

Sources cited
Papers I read for this question. These notes distinguish reviews from primary studies and identify the limits of my access.
Movement, uptake, and transfer all intensify as particles shrink toward nano.
Mulch is the largest source. No standard soil method exists yet.
Counts fragments under 5 mm, so any sub-micron fraction sits below it.
Floatation and filtration tuned to micro, not the nano part of the same sludge.
The clearest detection-limit method, with an explicit 10-micrometre cutoff.
What’s missing — the gap
If the density-separation-and-Nile-Red pipeline that counts microplastics down to about 10 micrometres were extended below that floor into the nanoscale, would soils already known to receive mulch, sludge, and fertiliser turn out to hold a nanoplastic fraction the micro-scale limits have been missing all along?
The tool is mature and the source streams are already quantified at the micro scale. Nobody has adapted the separation and staining steps to hold onto sub-micron particles and pointed the result at a soil we already understand. Because smaller particles move and get taken up more easily, the unmeasured fraction may be the one that matters most, and right now it is a blank in every existing count.
First moves
- 1
Find where the floor really is
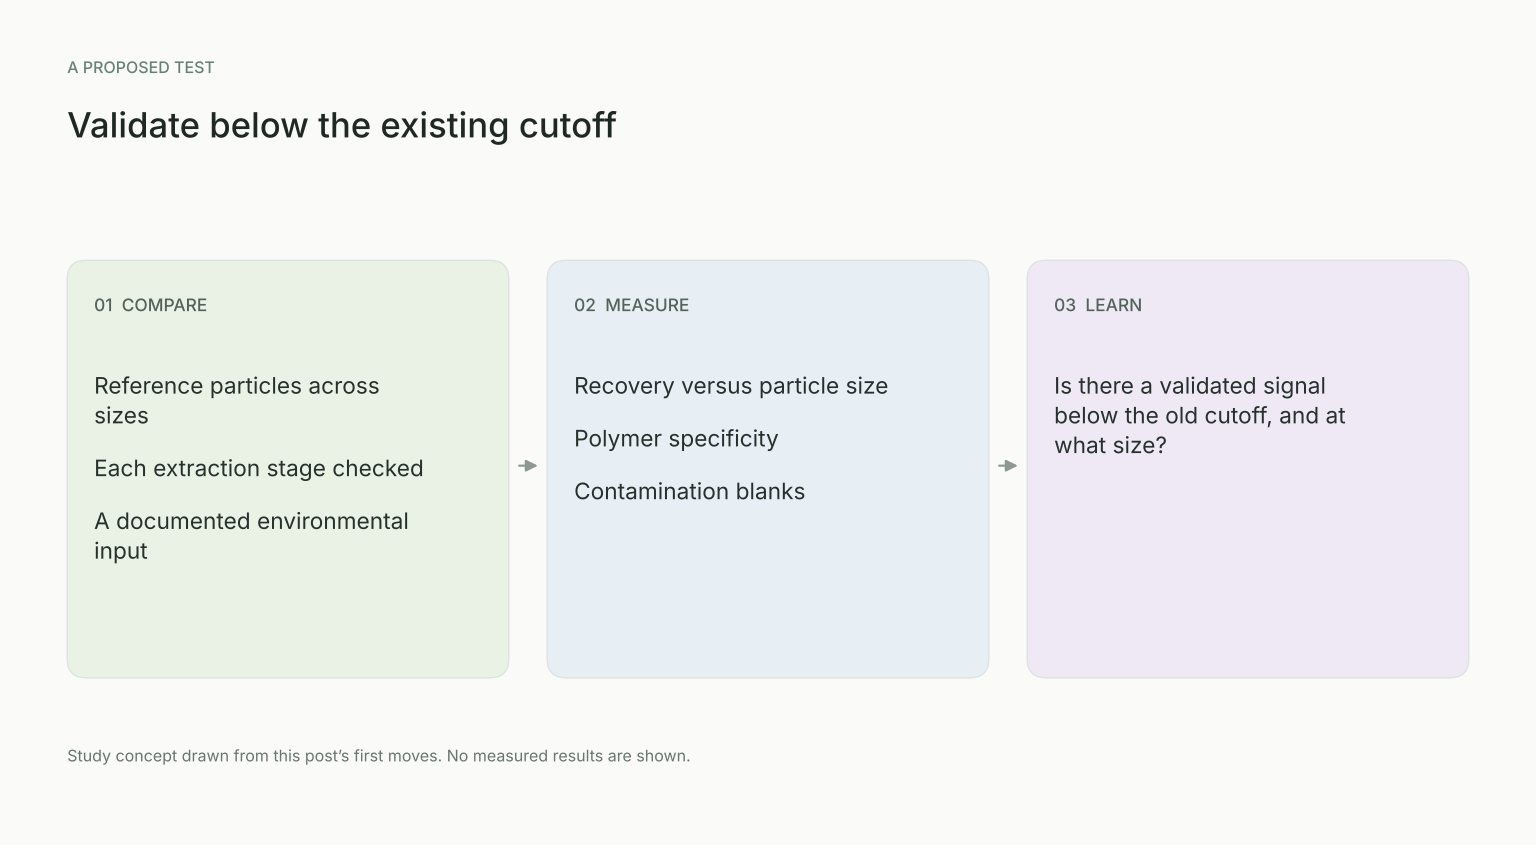
Take a mature micro-scale pipeline, peroxide digestion, flocculation, salt density separation, Nile Red counting, and measure its true lower size cutoff on spiked soil, then adapt the separation and staining to keep sub-micron particles instead of losing them at filtration.
- 2
Point it at a known source first
Start with a documented, quantified input like sewage sludge or weathered mulch film and screen it for a nanoscale fraction, so any signal ties to a source we already understand at the micro scale.
- 3
Set a limit and a blank before counting
Because no standard extraction method exists even for microplastics, define an explicit nanoscale detection limit and a contamination blank up front, so the first nano numbers can be compared by construction.
Where I land
Where I land: I think there is a real nanoplastic fraction already sitting in these soils, and the only reason it is missing from the record is that the standard method stops just above it. The physics points one way, smaller particles move and get eaten more, so the unmeasured size is likely the important one. My worry is that we keep publishing careful micro counts as if they were the whole picture. The first honest experiment is not a new instrument, it is finding out how far below the current cutoff an existing lab can already see.
An invitation
This one is for the people who already run these extractions, the analytical chemists and soil scientists who know exactly where their method quietly drops particles. If you have a density-separation or fluorescence pipeline running, the smallest honest experiment might be finding out how far below your current cutoff you can see, and whether anything is waiting there. If the tool exists and the soils are already full of the larger fragments, why has no one aimed it at the size below? What am I missing?
Questions about this gap
Is everything below 10 micrometres a nanoplastic?
No. A 10-micrometre cutoff leaves smaller microplastics unmeasured as well. Any nanoscale claim needs an explicit size definition and a method validated for it.
Why can the existing pipeline not simply be extended by assumption?
Digestion, filtration, separation, and detection may lose or misidentify smaller material. Each stage needs recovery and specificity checks over the new size range.
What should be established before counting a field sample?
Define the measurable size range, procedural blanks, and recovery with known reference material, then test whether the workflow identifies the intended polymer fraction.
Why begin with a documented input source?
A well-characterized sludge or mulch source provides a clearer starting point than an unexplained field signal. It still does not guarantee that a nano fraction will be detected.
Would a negative result prove there are no nanoplastics?
No. It would constrain what was detectable under the validated method and sample conditions. The detection limit belongs alongside the result.